
First National Household Travel Survey: Two-Wheelers Lead at 42.6%
NSO released India’s first National Household Travel Survey, covering 4,92,023 households, and found two-wheelers carry 42.6% of workers to fixed workplaces.
Why in News
On 5 October 2026 the National Statistics Office released the key indicators of India’s first National Household Travel Survey, conducted from July 2025 to June 2026, giving the country its first nationwide picture of commuting patterns.
The National Statistics Office (NSO), under the Ministry of Statistics and Programme Implementation, released the key findings of the country’s first National Household Travel Survey (NHTS) on 5 October 2026. The survey was carried out between July 2025 and June 2026 and the results have been put out through a factsheet. For its purposes, a trip counted only if it covered more than one kilometre.
How big the survey was
Field work spread over 14,274 villages and 10,377 urban blocks. Information was gathered from 4,92,023 households covering 20,34,371 persons, which makes it the first nationwide benchmark on how Indian households actually travel. The survey was designed to feed regional transport planning and infrastructure decisions, and also meets specific data needs of the Ministry of Railways.
How workers travel
The two-wheeler is the single biggest mode for getting to work, used by 42.6% of workers who travel to a workplace, rising to 52.3% in towns and cities and standing at 37.1% in villages. Walking is the next most common way of reaching work. In all, 57.6% of workers aged 15 and above make a daily trip of more than a kilometre, and the gap between men and women is wide: 61.9% of male workers against 41.9% of female workers. Metro, suburban rail, monorail and trams together carry 5.0% of urban workers, but the share jumps in Maharashtra, West Bengal and Delhi.
How students travel
Nearly two-thirds of students aged 6 and above, or 66.4%, travel more than a kilometre to reach their institution. Walking leads at 37.0%, followed by buses at 29.5% and bicycles at 15.8%, with auto-rickshaws serving 10.5% of them.
Time and money
| Indicator | Students | Workers |
| Average travel time | 23 minutes | 25 minutes |
| Reach within 30 minutes | 87.6% | 83.4% |
| Average monthly spend | ₹443 | ₹785 |
Urban workers spend ₹1,044 a month on the commute against ₹612 for rural workers, and male workers spend ₹835 against ₹533 for women. Peak departure for students is between 8 and 9 in the morning, while 94.9% of workers leave for a fixed workplace before 10 am.
Overnight travel
For journeys that keep a household member away for more than a day, buses carry 55.8% and inter-city railways 17.7%, followed by cars at 15.1% and two-wheelers at 8.8%. Socialising, communication and religious activity account for 70.2% of such trips, while culture, leisure, sport and tourism together make up 7.4%.
Important Facts
| Survey | National Household Travel Survey (NHTS), the first of its kind in India |
|---|---|
| Conducted by | National Statistics Office (NSO), Ministry of Statistics and Programme Implementation |
| Period | July 2025 to June 2026 |
| Coverage | 14,274 villages and 10,377 urban blocks |
| Sample | 4,92,023 households and 20,34,371 persons |
| Definition of a trip | Travel of more than one kilometre |
| Top mode for work trips | Two-wheelers, 42.6% of workers |
| Top modes for overnight trips | Buses 55.8% and inter-city railways 17.7% |
| Average monthly commute spend | ₹785 per worker and ₹443 per student |
Exam Point of View
Remember that this is the first-ever all-India travel survey, the conducting body (NSO under MoSPI), the period (July 2025 to June 2026), the sample (4,92,023 households and 20,34,371 persons across 14,274 villages and 10,377 urban blocks), the one-kilometre trip definition, the two-wheeler share of 42.6%, the ₹785 monthly worker spend and the bus and rail shares of 55.8% and 17.7% in overnight travel.
Practice Questions
Which organisation conducted India’s first National Household Travel Survey, released on 5 October 2026?
- A.NITI Aayog
- B.National Statistics Office
- C.Reserve Bank of India
- D.Census Commissioner of India
Show answer
Correct answer: B. National Statistics Office
Explanation
The correct answer is the National Statistics Office. The NSO, which works under the Ministry of Statistics and Programme Implementation, carried out the first all-India National Household Travel Survey between July 2025 and June 2026 and released its key indicators through a factsheet. Option A, NITI Aayog, is the government’s policy think tank and publishes indices of its own, but it does not run large household sample surveys of this kind. Option C, the Reserve Bank of India, conducts surveys on consumer confidence, inflation expectations and bank credit, not on travel behaviour of households. Option D is incorrect because the Census Commissioner conducts the decennial population census rather than sample surveys on commuting. Aspirants should link NSO and MoSPI with household surveys such as this one, remembering also that the survey additionally served the data requirements of the Ministry of Railways.
According to the National Household Travel Survey, which is the leading primary mode of transport for workers commuting to a workplace?
- A.Bus, 29.5% of workers
- B.Walking, 36.6% of workers
- C.Two-wheeler, 42.6% of workers
- D.Suburban rail, 20.7% of workers
Show answer
Correct answer: C. Two-wheeler, 42.6% of workers
Explanation
The correct answer is the two-wheeler, used by 42.6% of workers. The survey found the two-wheeler to be the single largest primary mode for work trips across the country, with a share of 52.3% in urban areas and 37.1% in rural areas. Option A quotes a bus share that belongs to student travel, not to work trips, where buses carry a far smaller proportion. Option B is a trap built from the rural walking figure; walking is indeed important and stands second among work trip modes, but it does not lead. Option D mixes up a state-level figure with the national one, since metro, suburban rail, monorail and trams together carry only 5.0% of urban workers nationally even though their use is far higher in a few states. Candidates should memorise the national two-wheeler share along with its urban and rural split.
What is the average monthly expenditure on commuting to a fixed workplace per worker, as reported by the survey?
- A.₹443
- B.₹612
- C.₹785
- D.₹1,044
Show answer
Correct answer: C. ₹785
Explanation
The correct answer is ₹785. The survey put the average monthly outlay on commuting to a fixed workplace at ₹785 for each worker, and the figure hides a sharp divide: urban workers spend ₹1,044 a month while rural workers spend ₹612. Option A is the average monthly spend of students on travel to their educational institution, not of workers. Option B is the rural worker figure alone, so it understates the national average. Option D is the urban worker figure, which is higher than the national average rather than equal to it. There is also a gender gap worth remembering, with male workers spending ₹835 a month against ₹533 for female workers. Questions on this survey are likely to swap the student and worker numbers or the rural and urban ones, so fix all four in memory together.
In household overnight travel, which two modes together account for about 73.5% of trips?
- A.Cars and two-wheelers
- B.Buses and inter-city railways
- C.Air travel and railways
- D.Auto-rickshaws and buses
Show answer
Correct answer: B. Buses and inter-city railways
Explanation
The correct answer is buses and inter-city railways. The survey reported that buses carry 55.8% of household overnight trips and inter-city railways another 17.7%, which together make up roughly three-quarters of such travel. Cars follow at 15.1% and two-wheelers at 8.8%, so option A describes the next tier rather than the leading pair. Option C is wrong because air travel does not figure among the leading modes for overnight household journeys in the survey’s findings. Option D is incorrect since auto-rickshaws serve short within-day trips rather than overnight ones. It is also worth noting that rail use for overnight trips is about 22.7% among urban households against about 14.0% among rural households, and that socialising, communication and religious activity drive 70.2% of all overnight household travel.
Frequently Asked Questions
Who conducted the National Household Travel Survey?
The National Statistics Office (NSO) under the Ministry of Statistics and Programme Implementation. It is the first all-India survey on household travel and was conducted from July 2025 to June 2026.
Which is the most used mode of transport for going to work?
The two-wheeler, used by 42.6% of workers who travel to a workplace. Its share is 52.3% in urban areas and 37.1% in rural areas; walking is the next most common mode for work trips.
What counts as a trip in the NHTS?
Only travel covering more than one kilometre. Journeys shorter than a kilometre were not recorded, which is why the survey reports that 66.4% of students and 57.6% of workers undertake such trips.
How do households travel on overnight journeys?
Mostly by bus and train. Buses account for 55.8% of overnight household trips and inter-city railways 17.7%, followed by cars at 15.1% and two-wheelers at 8.8%.
Sources
- https://www.pib.gov.in/PressReleasePage.aspx?PRID=2319180 (opens in a new tab) — Press Information Bureau
Current Affairs 5 October 2026
- UCIL Marks Diamond Jubilee Year of Uranium MiningScience & Technology
- TDB Backs Project VeerAI With Rs 130 Crore for AI Vision ChipScience & Technology
- India, Switzerland Sign Mobility and Infrastructure AgreementsInternational
- Infrastructure Push Cuts Travel Time, 549 Trains Speeded UpNational
- Coal India Offtake Reaches 384.2 MT in First Half of 2026-27Economy
- Sanchar Saathi Portal Crosses 30 Crore Visits Against Telecom FraudScience & Technology
- Gadkari Opens Chintan Shivir 2026 on Highway InfrastructureSummits & Conferences
- DST Marks Swachhata Hi Sewa 2026, Felicitates 110 Safai MitrasGovernment Schemes
Related Current Affairs
- Reports & Indices
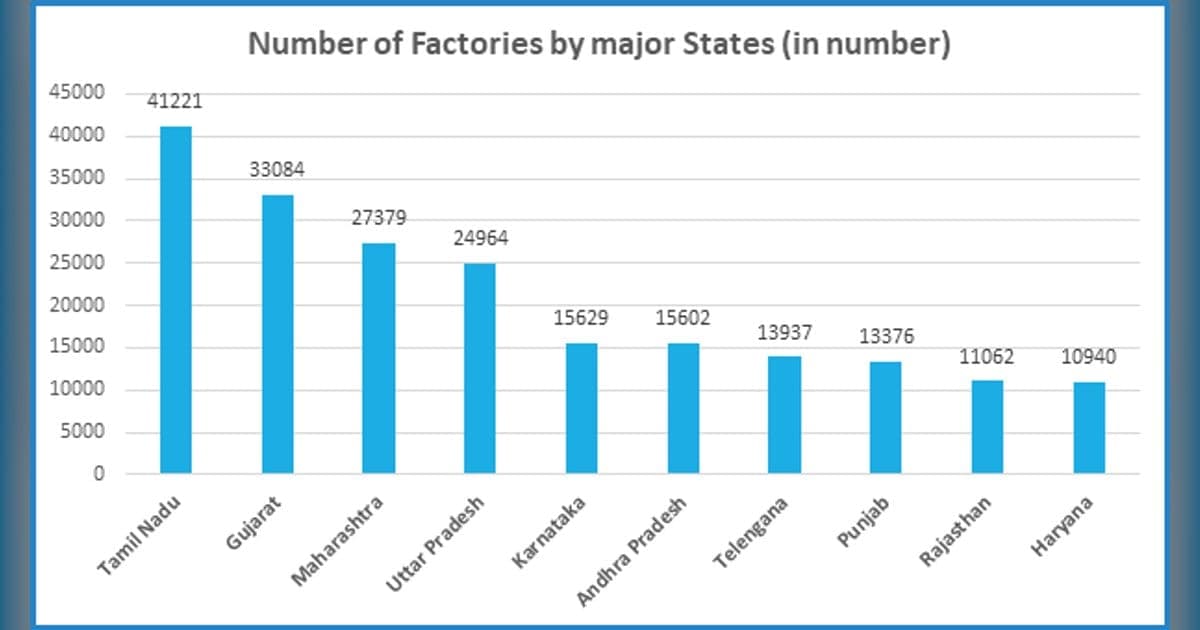
ASI 2024-25 Counts 2.67 Lakh Factories, GVA Up 9.59 Per Cent
30 September 2026 · 2 min read
- Reports & Indices
RIS Study Puts Ayush Services Economy at $36.92 Billion
30 September 2026 · 2 min read
- Reports & Indices
MoSPI Releases Trial Index of Services Production for July 2026
29 September 2026 · 2 min read
- Reports & Indices
Literacy Rate Reaches 81.1% as Ten States Declare Full Literacy
29 September 2026 · 2 min read
- Reports & Indices
Broadband Users Reach 1101.21 Million in India in August 2026
28 September 2026 · 2 min read
Related GK
- Science Policy and Research Funding in India: Exam Notes
6 October 2026 · Science & Technology
- Goa GK: Liberation, Statehood, Geography and Facts
6 October 2026 · Indian States & UTs
- Statues, Towers and Landmarks of India for Exams
6 October 2026 · Static GK
Take the Quiz
- Current Affairs Quiz
SBI Current Affairs Quiz: 5 October 2026
10 questions10 minutesStart Quiz