
ASI 2024-25 Counts 2.67 Lakh Factories, GVA Up 9.59 Per Cent
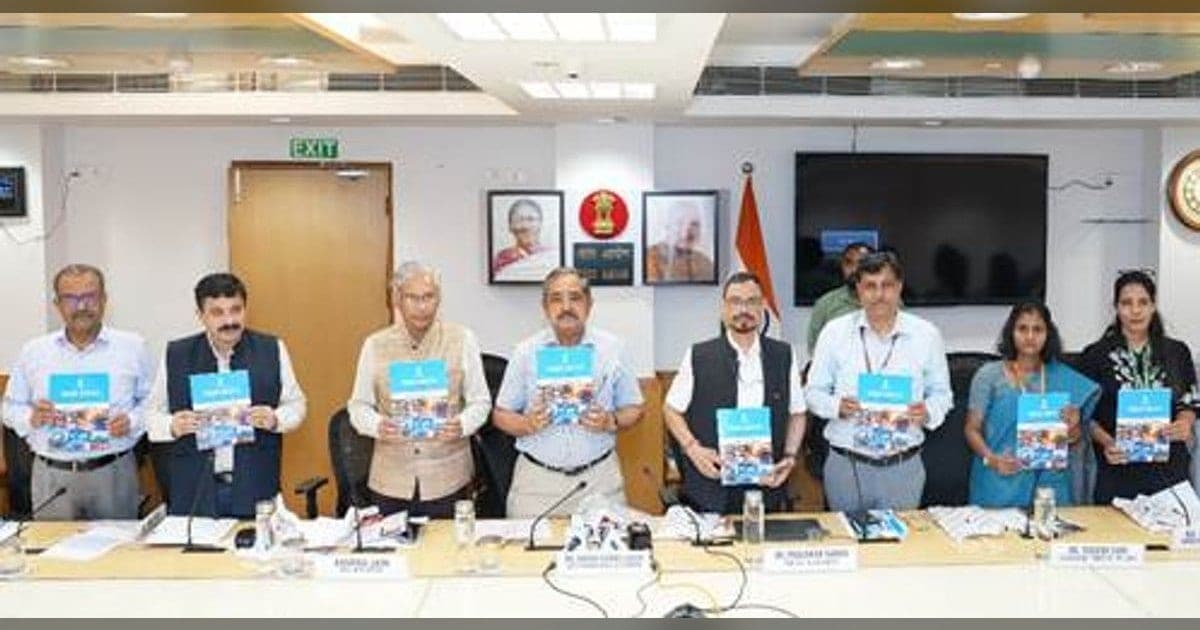
MoSPI released Annual Survey of Industries results for 2024-25, showing 2.67 lakh registered manufacturing units and gross value added higher by 9.59 per cent.
Why in News
On 30 September 2026 the Ministry of Statistics and Programme Implementation released the results of the Annual Survey of Industries for 2024-25, reporting 2.67 lakh registered manufacturing establishments and gross value added growth of 9.59 per cent.
The Ministry of Statistics and Programme Implementation (MoSPI) published the factsheet of the Annual Survey of Industries (ASI) for the reference period April 2024 to March 2025, that is financial year 2024-25. Field work for this round ran from October 2025 to June 2026. The survey is the country's chief reading of the registered factory sector and feeds the National Accounts Statistics.
How many factories, and where
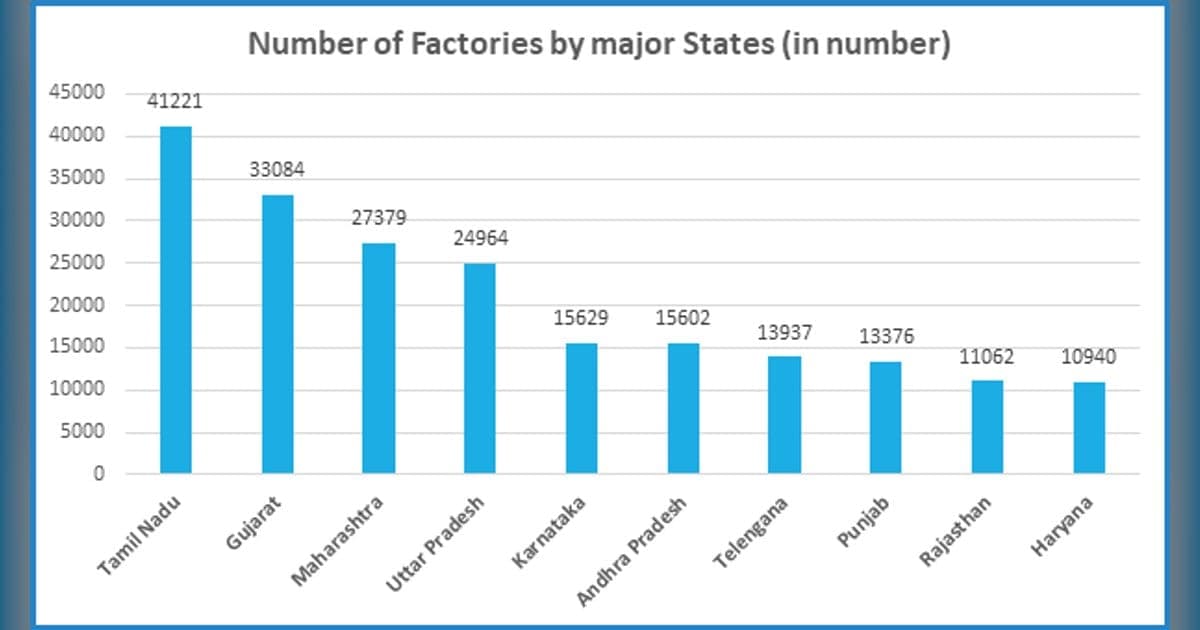
Registered manufacturing establishments rose from 2.60 lakh in the previous round to 2.67 lakh, a growth of 2.64 per cent. Tamil Nadu reported the most establishments at 41,221, followed by Gujarat with 33,084 and Maharashtra with 27,379.
The headline growth figures
| Indicator | Growth in 2024-25 |
| Gross Value Added | 9.59 per cent |
| Industrial output | 7.81 per cent |
| Fixed capital | 10.54 per cent |
| Invested capital | 11.10 per cent |
| Total employment | 7.19 per cent |
| Emoluments | 12.08 per cent |
| Net income | 9.68 per cent |
| Net profit | 7.73 per cent |
In money terms gross value added moved from Rs 2,458.3 thousand crore to Rs 2,694.2 thousand crore. Invested capital is counted as fixed capital plus physical working capital.
Jobs cross the two-crore mark
Persons engaged in registered manufacturing rose from 1.96 crore to 2.10 crore, an addition of more than 14 lakh workers that carried estimated total employment past the two-crore mark. Tamil Nadu, Maharashtra, Gujarat, Uttar Pradesh and Haryana were the five leading states for persons engaged and together held about 56 per cent of manufacturing employment.
Which states and industries lead
For value added, Maharashtra stood first, followed by Gujarat, Tamil Nadu, Karnataka and Uttar Pradesh; these five together accounted for more than 54 per cent of the country's manufacturing gross value added and 53.30 per cent of all establishments. Among industries, basic metal, motor vehicles, chemicals and chemical products, pharmaceutical products and food products together contributed more than 45 per cent of manufacturing value added.
What the survey covers
The ASI takes in factories registered under Sections 2m(i) and 2m(ii) of the Factories Act, 1948, bidi and cigar units under the Bidi and Cigar Workers Act of 1966, electricity undertakings not registered with the Central Electricity Authority, and units with 100 or more employees in the Business Register of Establishments. Data are collected on a web portal with no paper schedule, under the Collection of Statistics Act of 2008 as amended in 2017, with rules framed in 2011.
Important Facts
| Survey | Annual Survey of Industries (ASI) 2024-25 |
|---|---|
| Released by | Ministry of Statistics and Programme Implementation (MoSPI) |
| Reference period | April 2024 to March 2025 |
| Field work | October 2025 to June 2026 |
| Establishments | 2.67 lakh, up 2.64 per cent from 2.60 lakh |
| Gross Value Added | Rs 2,694.2 thousand crore, up 9.59 per cent from Rs 2,458.3 thousand crore |
| Persons engaged | 2.10 crore, up 7.19 per cent from 1.96 crore |
| Most establishments | Tamil Nadu (41,221), then Gujarat (33,084) and Maharashtra (27,379) |
| Highest GVA | Maharashtra; top five states hold more than 54 per cent of manufacturing GVA |
| Top industries | Basic metal, motor vehicles, chemicals, pharmaceuticals and food products, together over 45 per cent of manufacturing GVA |
| Parent law | Factories Act, 1948, Sections 2m(i) and 2m(ii) |
Exam Point of View
Remember the releasing ministry (MoSPI), the reference period (April 2024 to March 2025), establishments (2.67 lakh, up 2.64 per cent from 2.60 lakh), GVA growth (9.59 per cent) and its value (Rs 2,694.2 thousand crore), employment (1.96 crore to 2.10 crore, up 7.19 per cent), the state with most factories (Tamil Nadu, 41,221), the state with highest GVA (Maharashtra), and the parent law (Factories Act, 1948).
Practice Questions
According to the Annual Survey of Industries 2024-25, how many registered manufacturing establishments does India have?
- A.2.10 lakh
- B.2.60 lakh
- C.2.67 lakh
- D.3.21 lakh
Show answer
Correct answer: C. 2.67 lakh
Explanation
The correct answer is 2.67 lakh. The survey for the year ending March 2025 counted that many registered manufacturing establishments, and the sector grew by 2.64 per cent on this measure. Option A is wrong because 2.10 belongs to a different indicator entirely, the number of persons engaged in crore. Option B, 2.60 lakh, is the count reported in the previous round and so describes the earlier year rather than this one. Option D is wrong because no such figure appears in the results. Tamil Nadu reported the largest number of establishments at 41,221, followed by Gujarat at 33,084 and Maharashtra at 27,379. The top five states by value added together accounted for 53.30 per cent of all establishments in the country.
By what percentage did Gross Value Added of registered manufacturing grow in 2024-25?
- A.7.19 per cent
- B.9.59 per cent
- C.10.54 per cent
- D.12.08 per cent
Show answer
Correct answer: B. 9.59 per cent
Explanation
The correct answer is 9.59 per cent. Gross value added rose from Rs 2,458.3 thousand crore to Rs 2,694.2 thousand crore, which works out to that rate of growth. Option A, 7.19 per cent, is wrong because it is the growth in total employment, the rise in persons engaged from 1.96 crore to 2.10 crore. Option C, 10.54 per cent, is wrong because it measures fixed capital, not value added. Option D, 12.08 per cent, is wrong because that is the increase in emoluments paid to the workforce, the fastest-growing of the headline indicators in this round. Industrial output for its part grew 7.81 per cent, invested capital 11.10 per cent, net income 9.68 per cent and net profit 7.73 per cent, making the expansion a broad-based one.
Which state reported the highest number of factories in the Annual Survey of Industries 2024-25?
- A.Maharashtra
- B.Gujarat
- C.Tamil Nadu
- D.Uttar Pradesh
Show answer
Correct answer: C. Tamil Nadu
Explanation
The correct answer is Tamil Nadu, with 41,221 establishments, the largest count of any state in this round. Option B, Gujarat, comes second at 33,084 and is therefore wrong. Option A, Maharashtra, is third by count at 27,379, and it is worth separating the two rankings here: Maharashtra leads the country in gross value added even though it has fewer factories than Tamil Nadu and Gujarat. Option D, Uttar Pradesh, is wrong because it figures in the top five for value added and for employment but not at the head of the establishment count. Taken together, Maharashtra, Gujarat, Tamil Nadu, Karnataka and Uttar Pradesh accounted for more than 54 per cent of the country's manufacturing gross value added during the year.
Which five industries together contributed more than 45 per cent of India's manufacturing gross value added in 2024-25?
- A.Textiles, leather, paper, rubber and plastics
- B.Basic metal, motor vehicles, chemicals, pharmaceuticals and food products
- C.Cement, glass, fertiliser, sugar and jute
- D.Electronics, software, telecom equipment, batteries and solar cells
Show answer
Correct answer: B. Basic metal, motor vehicles, chemicals, pharmaceuticals and food products
Explanation
The correct answer is basic metal, motor vehicles, chemicals and chemical products, pharmaceutical products and food products. These five industry groups together accounted for more than 45 per cent of the country's manufacturing value added during the year, which shows how concentrated factory output remains in a handful of heavy and consumer-facing industries. Options A, C and D list other industry groups and are wrong; none of those combinations is named among the leading five in the results. Alongside this industrial concentration the survey shows a regional one: Tamil Nadu, Maharashtra, Gujarat, Uttar Pradesh and Haryana were the five leading states for persons engaged and together held about 56 per cent of total manufacturing employment in the country, while the top five states by value added held 53.30 per cent of all establishments.
Frequently Asked Questions
How many registered manufacturing establishments did ASI 2024-25 report?
2.67 lakh, up from 2.60 lakh in the previous round, a growth of 2.64 per cent. Tamil Nadu had the highest count at 41,221, followed by Gujarat and Maharashtra.
By how much did gross value added grow in ASI 2024-25?
By 9.59 per cent, rising from Rs 2,458.3 thousand crore to Rs 2,694.2 thousand crore. Industrial output grew 7.81 per cent and fixed capital 10.54 per cent.
What happened to employment in registered manufacturing in 2024-25?
Persons engaged rose from 1.96 crore to 2.10 crore, a growth of 7.19 per cent, crossing the two-crore mark. Total emoluments paid rose 12.08 per cent over the previous year.
Which ministry conducts the Annual Survey of Industries?
The Ministry of Statistics and Programme Implementation. The survey covers factories registered under the Factories Act, 1948, and its results feed the National Accounts Statistics.
Sources
- Release of the Annual Survey of Industries (2024-25) results (opens in a new tab) — Press Information Bureau
Current Affairs 30 September 2026
- CAFE Norms 2027-32 Notified, Fuel Use to Fall 16.7 Per CentEnvironment
- UPSC Completes 100 Years of Merit-Based RecruitmentNational
- Second Naval Commanders Conference 2026 Opens in New DelhiDefence
- MHI Industry Accelerator Impact Report Released at NavigyaanScience & Technology
- SBM 2.0: Rs 11,785 Crore Approved for Sewage Treatment PlantsEnvironment
- TRAI Releases Mobile Network Drive Test Findings for SonitpurScience & Technology
- Special Campaign 6 to Run from 2 to 31 October 2026National
- PSS Buying of Rs 5,547.99 Crore Cleared for Kharif 2026-27Government Schemes
Related Current Affairs
- Reports & Indices
RIS Study Puts Ayush Services Economy at $36.92 Billion
30 September 2026 · 2 min read
- Reports & Indices
MoSPI Releases Trial Index of Services Production for July 2026
29 September 2026 · 2 min read
- Reports & Indices
Literacy Rate Reaches 81.1% as Ten States Declare Full Literacy
29 September 2026 · 2 min read
- Reports & Indices
Broadband Users Reach 1101.21 Million in India in August 2026
28 September 2026 · 2 min read
- Reports & Indices
NITI Aayog Releases Ninth Trade Watch Quarterly Edition
16 September 2026 · 2 min read
- Reports & Indices
PLFS Bulletin August 2026: LFPR Rises to 55.6 Per Cent
15 September 2026 · 2 min read

Related GK
- Punjab GK: Formation, Rivers, History and Exam Facts
30 September 2026 · Indian States & UTs
- Indian Defence Forces and Missiles: Static GK and PYQs
30 September 2026 · Static GK
- Biotechnology in Agriculture and Health: Notes and PYQs
30 September 2026 · Science & Technology
Take the Quiz
- Current Affairs Quiz
State Exams Current Affairs Quiz: 30 September 2026
25 questions25 minutesStart Quiz