
ASI 2024-25 Reports 9.28 Per Cent Manufacturing GVA Growth
MoSPI released Annual Survey of Industries 2024-25 Volume I, showing the manufacturing corporate sector's gross value added growing 9.28 per cent in a year.
Why in News
On 4 November 2026 the Ministry of Statistics and Programme Implementation released the detailed publications of the Annual Survey of Industries 2024-25, which show the manufacturing corporate sector's gross value added rising by 9.28 per cent over the previous year.
The Ministry of Statistics and Programme Implementation has put out the detailed publications of the Annual Survey of Industries (ASI) 2024-25, namely Volume I and the Summary Results of the Factory Sector, along with unit-level data and metadata. The survey covers the financial year 2024-25, that is April 2024 to March 2025, and the field work ran from October 2025 to June 2026. A factsheet from the same round had been issued on 30 September 2026, and the two detailed volumes now complete the release.
How registered manufacturing fared
The registered manufacturing sector grew across the main economic measures. The gross value of plant and machinery rose by 7.25 per cent over the previous year. The manufacturing corporate sector, which accounts for more than 89 per cent of total gross value added, reported a 9.28 per cent rise in GVA, a 3.45 per cent increase in the number of factories in operation and a 7.57 per cent increase in total persons engaged. Net value added per factory in operation improved by 6.59 per cent, while GVA per person engaged went up by 2.25 per cent.
Who makes and who employs
Five industries together carry more than 41 per cent of the country's manufacturing employment: food products, textiles, basic metals, motor vehicles and wearing apparel. On output, Maharashtra, Gujarat, Tamil Nadu, Karnataka and Uttar Pradesh are the five leading states, holding more than 54 per cent of India's manufacturing GVA in 2024-25.
Small plants, large plants
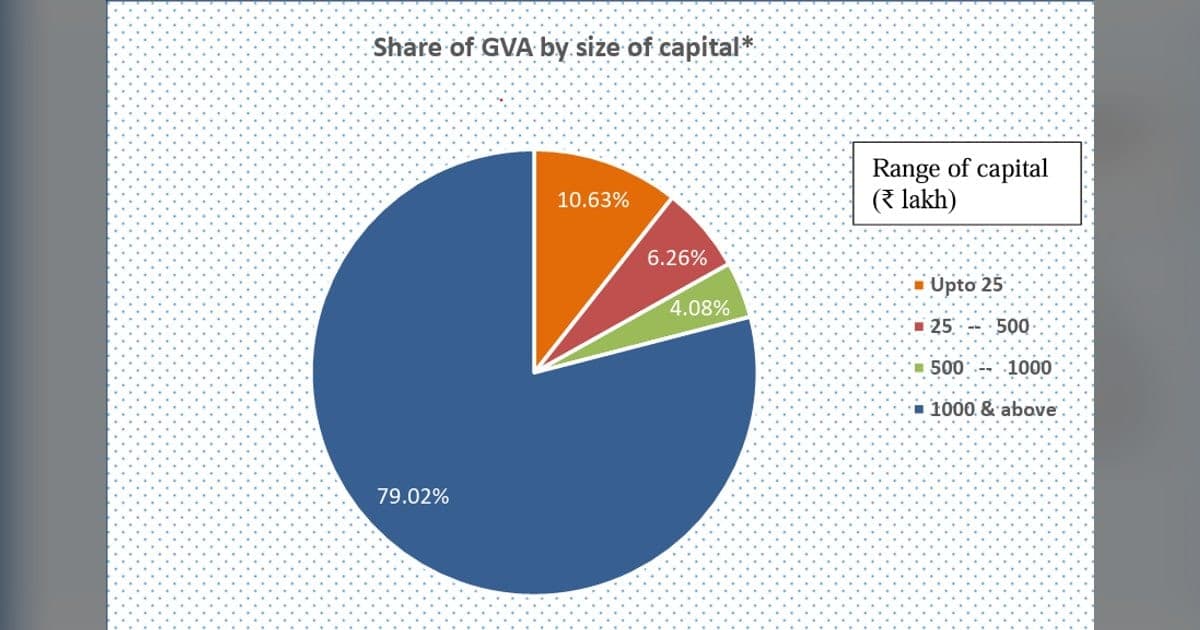
Classified by the gross value of plant and machinery, factories with investment of up to five crore rupees form 78.69 per cent of all units that operated during the year, but hold only 10.55 per cent of fixed capital. They employ 34.32 per cent of persons engaged and contribute 19.24 per cent of output and 17.61 per cent of net value added. At the other end, units with plant and machinery of ten crore rupees and above are 15.84 per cent of operating factories yet hold 87.42 per cent of fixed capital, 59.66 per cent of employment, 76.82 per cent of gross output and 78.07 per cent of net value added.
About the survey
The ASI covers factories registered under sections 2m(i) and 2m(ii) of the Factories Act, 1948, bidi and cigar establishments under the Act of 1966, electricity undertakings outside the Central Electricity Authority's register, and units with 100 or more employees listed in the Business Register of Establishments. Results are published by industry code under the National Industrial Classification, 2008, and data are collected on a web portal under the Collection of Statistics Act, 2008.
Important Facts
| Survey | Annual Survey of Industries (ASI) 2024-25 |
|---|---|
| Released by | Ministry of Statistics and Programme Implementation (MoSPI) |
| Publications | Volume I and Summary Results of Factory Sector, with unit-level data |
| Reference period | April 2024 to March 2025; survey conducted October 2025 to June 2026 |
| Manufacturing GVA growth | 9.28 per cent over the previous year, corporate sector |
| Net value added per factory | Up 6.59 per cent |
| GVA per person engaged | Up 2.25 per cent |
| Top five states by GVA | Maharashtra, Gujarat, Tamil Nadu, Karnataka, Uttar Pradesh |
| Industry classification | National Industrial Classification (NIC), 2008 |
Exam Point of View
Remember the survey (Annual Survey of Industries 2024-25), the ministry (MoSPI), the reference year (2024-25) and field period (October 2025 to June 2026), the headline growth figures of 9.28 per cent in GVA, 6.59 per cent in net value added per factory and 2.25 per cent in GVA per person engaged, the top five employing industries, the top five states by GVA, and the governing laws, the Factories Act, 1948 and the Collection of Statistics Act, 2008.
Practice Questions
According to the Annual Survey of Industries 2024-25, by how much did the gross value added of the manufacturing corporate sector grow over the previous year?
- A.6.59 per cent
- B.7.25 per cent
- C.9.28 per cent
- D.2.25 per cent
Show answer
That is the growth in gross value added recorded by the manufacturing corporate sector, which holds a share of more than 89 per cent in total GVA.
Read the full explanation →Which five states accounted for more than 54 per cent of India's manufacturing gross value added in 2024-25?
- A.Maharashtra, Gujarat, Tamil Nadu, Karnataka and Uttar Pradesh
- B.Gujarat, Rajasthan, Punjab, Haryana and Kerala
- C.West Bengal, Odisha, Bihar, Jharkhand and Assam
- D.Maharashtra, Telangana, Andhra Pradesh, Goa and Delhi
Show answer
The survey names these five as the leading states in gross value added, with a combined share of more than 54 per cent of the country's manufacturing GVA.
Read the full explanation →Under which law are factories primarily covered by the Annual Survey of Industries registered?
- A.The Industries (Development and Regulation) Act, 1951
- B.The Factories Act, 1948
- C.The Companies Act, 2013
- D.The Micro, Small and Medium Enterprises Development Act, 2006
Show answer
The survey covers factories registered under sections 2m(i) and 2m(ii) of that Act, and in addition bidi and cigar manufacturing establishments registered under the law of 1966 for workers in that trade, electricity undertakings not registered with the Central Electricity Authority, and units with a hundred or more employees listed…
Read the full explanation →Frequently Asked Questions
What growth did the manufacturing corporate sector record in ASI 2024-25?
Its gross value added grew 9.28 per cent over the previous year. The same sector, which holds more than 89 per cent of total GVA, added 3.45 per cent more factories in operation and 7.57 per cent more persons engaged.
Which states lead in manufacturing gross value added?
Maharashtra, Gujarat, Tamil Nadu, Karnataka and Uttar Pradesh, which together account for more than 54 per cent of India's manufacturing GVA in 2024-25.
Which industries employ the most in Indian manufacturing?
Food products, textiles, basic metals, motor vehicles and wearing apparel, which together provide more than 41 per cent of total manufacturing employment in 2024-25.
Sources
- https://www.pib.gov.in/PressReleasePage.aspx?PRID=2332475 (opens in a new tab) — Press Information Bureau
Current Affairs 4 November 2026
- India-Poland Trade Push: Jitin Prasada Visits WarsawInternational
- NLMC Phase II RINL Land Auction Fetches Rs 218 CroreEconomy
- Railways Freight Loading Hits 145.07 MT in October 2026Economy
- CSIR and DAKSHIN-RIS Sign Pact for Global South ScienceScience & Technology
- Ayush Minister Ties Dhanteras to Preventive HealthcareImportant Days
- Schedule M Amendment Aligns Grade A Limits With WHO NormsNational
- Cabinet Clears Rs 2,814 Crore Critical Mineral Capex SchemeGovernment Schemes
- Cabinet Approves Rs 4,371.10 Crore VISTAR Statistics SchemeEconomy
Related Current Affairs
- Reports & Indices
NITI Aayog Launches India S&T Scoreboard for States and UTs
3 November 2026 · 2 min read
- Reports & Indices
TRAI: India's Tele-density at 95.52 Per Cent in September 2026
27 October 2026 · 2 min read






Related GK
- Famous Personalities of Rajasthan: Exam Notes
28 October 2026 · Rajasthan
- Districts and Divisions of Rajasthan: Exam Notes
28 October 2026 · Rajasthan
- Tourism and World Heritage Sites of Rajasthan Notes
27 October 2026 · Rajasthan
Take the Quiz
- Current Affairs Quiz
State Exams Current Affairs Quiz: 4 November 2026
25 questions25 minutesStart Quiz