
India's Exports Reach 399.27 Billion Dollars in April-August
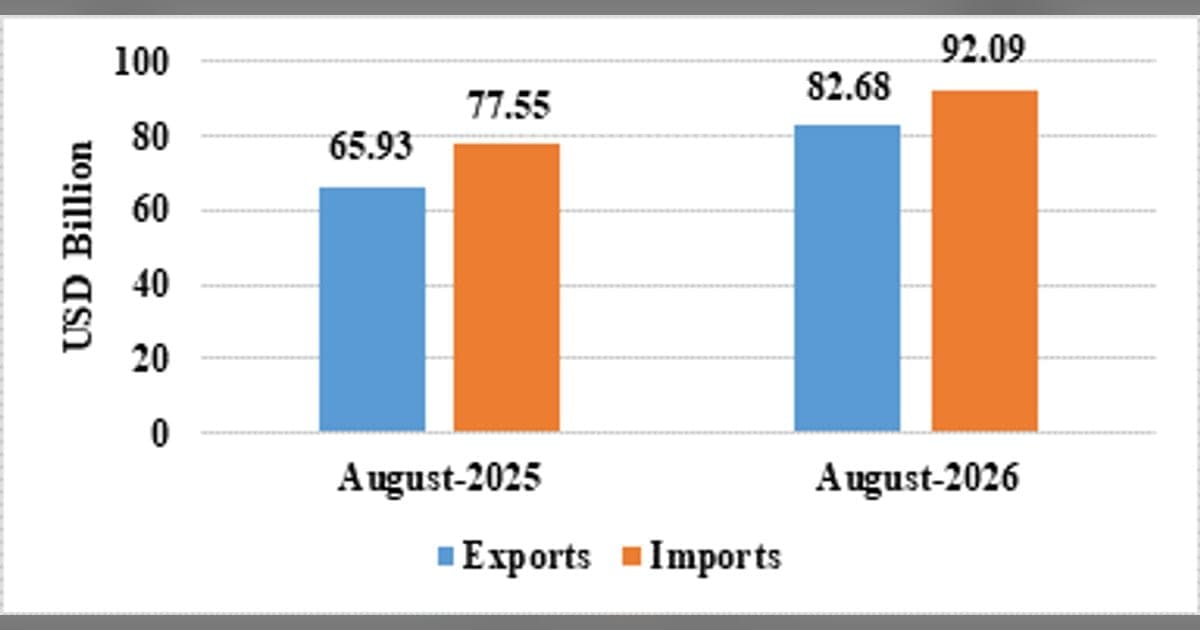
India's total exports of goods and services in April-August 2026-27 are estimated at 399.27 billion dollars, a growth of 15.55 per cent over the same months last year.
Why in News
On 15 September 2026 the Ministry of Commerce and Industry released India's trade data for August 2026, estimating cumulative exports of goods and services at 399.27 billion dollars for April-August 2026-27.
The Ministry of Commerce and Industry released the trade figures for August 2026 on 15 September 2026. Total exports of goods and services in the five months from April to August of 2026-27 are estimated at 399.27 billion US dollars. The comparable figure a year earlier was 345.55 billion dollars. That works out to a growth of 15.55 per cent.
The month of August
Exports in August alone are estimated at 82.68 billion dollars. That is a rise of 25.41 per cent over the same month of the previous year. Imports in the month are estimated at 92.09 billion dollars, a rise of 18.75 per cent. Merchandise exports in the month stood at 43.81 billion dollars against 34.74 billion a year earlier.
Goods and services separately
| Item, April-August 2026-27 | Value in billion dollars |
| Total exports | 399.27 |
| Total imports | 459.65 |
| Merchandise exports | 215.91 |
| Services exports | 183.36 |
| Non-petroleum exports | 180.61 |
Merchandise exports of 215.91 billion dollars compare with 183.21 billion in the same months of the previous year, a growth of 17.85 per cent. Non-petroleum exports of 180.61 billion dollars are 14.39 per cent above the earlier figure of 157.89 billion. Total imports of 459.65 billion dollars grew by 18.01 per cent.
What pushed exports up
The release names the leading drivers of merchandise export growth in the month. Electronic goods lead the list. Their exports rose by 89.82 per cent, from 2.93 billion dollars to 5.55 billion. Petroleum products, engineering goods, organic and inorganic chemicals, cotton yarn and handloom products also grew. Iron ore recorded the steepest rise among the commodity groups listed.
Points worth remembering
Note that services data for the month is an estimate, because the latest released figures for that sector cover the previous month. Remember the pair of headline numbers, the cumulative export value and its growth rate, since questions are usually set on those two. Also remember that the financial year quoted runs from April, which is why the release covers five months.
Important Facts
| Released by | Ministry of Commerce and Industry, 15 September 2026 |
|---|---|
| Cumulative exports, April-August 2026-27 | 399.27 billion US dollars |
| Growth over last year | 15.55 per cent |
| Cumulative imports | 459.65 billion US dollars, up 18.01 per cent |
| Exports in August 2026 | 82.68 billion US dollars, up 25.41 per cent |
| Imports in August 2026 | 92.09 billion US dollars, up 18.75 per cent |
| Merchandise exports, April-August | 215.91 billion US dollars, up 17.85 per cent |
| Non-petroleum exports | 180.61 billion US dollars, up 14.39 per cent |
| Top growth item | Electronic goods, up 89.82 per cent in the month |
Exam Point of View
Remember the cumulative export figure of 399.27 billion dollars and its growth of 15.55 per cent, the August export figure of 82.68 billion dollars, the merchandise export figure of 215.91 billion dollars, and the fact that electronic goods led the growth in the month.
Practice Questions
What is the estimated value of India's total exports of goods and services during April-August 2026-27?
- A.345.55 billion US dollars
- B.399.27 billion US dollars
- C.459.65 billion US dollars
- D.215.91 billion US dollars
Show answer
Correct answer: B. 399.27 billion US dollars
Explanation
The correct answer is 399.27 billion US dollars, the cumulative figure for merchandise and services exports taken together over the five months of the current financial year covered by the release. Option A is the same cumulative export figure for the corresponding months of the previous financial year, and it is the number against which the growth rate is worked out, so it belongs in the comparison rather than in the answer. Option C is the cumulative import figure for the current period, which is larger than exports and therefore leaves a trade deficit. Option D is merchandise exports alone, that is goods without services, and a candidate who forgets that the headline number combines both will fall for it. Fix the pair together: the export value and the growth rate that goes with it.
Which commodity group recorded an export growth of 89.82 per cent in August 2026?
- A.Engineering goods
- B.Petroleum products
- C.Electronic goods
- D.Marine products
Show answer
Correct answer: C. Electronic goods
Explanation
The correct answer is electronic goods, whose exports in the month climbed from 2.93 billion dollars a year earlier to 5.55 billion dollars, a jump the release lists first among the drivers of merchandise export growth. Option A is wrong; engineering goods did grow, but at a far smaller rate, rising from 9.87 billion dollars to 12.32 billion. Option B is wrong as well; petroleum products grew strongly in the month, yet their rate was lower than that of electronics. Option D is wrong because marine products appear only in the longer list of commodity groups with positive growth and are nowhere near the top. The lesson for an aspirant is to attach the highest growth rate of the month to electronics, and to remember that the release names the drivers in descending order of importance.
Which ministry releases India's monthly merchandise and services trade data?
- A.Ministry of Finance
- B.Ministry of Commerce and Industry
- C.Ministry of Statistics and Programme Implementation
- D.Ministry of Corporate Affairs
Show answer
Correct answer: B. Ministry of Commerce and Industry
Explanation
The correct answer is the Ministry of Commerce and Industry, which issued these estimates for the month and for the cumulative period of the financial year. Option A is wrong because the finance ministry handles taxation, expenditure and the budget rather than the monthly trade release, although it does publish revenue collections. Option C is wrong because the statistics ministry brings out national income and labour force data, not the export and import bulletin. Option D is wrong because corporate affairs deals with company law and registration. One more caution is worth remembering with this release: the services figures for the latest month are an estimate, since the released data for that sector covers only the previous month, and the earlier months of the year have been revised using quarterly balance of payments data.
Frequently Asked Questions
What were India's cumulative exports in April-August 2026-27?
Total exports of merchandise and services together are estimated at 399.27 billion US dollars, against 345.55 billion in the same period of the previous year, a growth of 15.55 per cent.
Which sector led merchandise export growth in August 2026?
Electronic goods. Their exports rose by 89.82 per cent, from 2.93 billion dollars in August 2025 to 5.55 billion dollars in August 2026. Petroleum products and engineering goods also grew strongly.
What were India's merchandise exports in April-August 2026-27?
Merchandise exports were valued at 215.91 billion US dollars, compared with 183.21 billion in the same months of the previous year, registering a positive growth of 17.85 per cent.
Sources
Current Affairs 15 September 2026
- India-US Exercise Yudh Abhyas 2026 Begins at Auli and MahajanDefence
- VIMARSH 2026: DRDO Hands Nine Technology Transfer LicencesDefence
- PLFS Bulletin August 2026: LFPR Rises to 55.6 Per CentReports & Indices
- UPI Stays Free for P2P and 96% of Merchant PaymentsBanking & Finance
- World Circular Economy Forum 2026 Opens in GandhinagarSummits & Conferences
- India Sends Largest-Ever Team to WorldSkills Shanghai 2026National
- CCPA Fines Rapido 10 Lakh Rupees for Dark PatternsNational
Related Current Affairs
- Economy
Steel Sector Grows in April-August 2026; NMDC Sets August Record
23 September 2026 · 2 min read




Related GK
- Fundamental Rights (Articles 12–35): Notes, Writs and PYQs
23 September 2026 · Indian Polity
- Preamble of the Indian Constitution: Notes, Keywords and PYQs
22 September 2026 · Indian Polity
- Making of the Indian Constitution: Notes, Key Dates and PYQs
21 September 2026 · Indian Polity
Take the Quiz
- Current Affairs Quiz
State Exams Current Affairs Quiz: 15 September 2026
24 questions24 minutesStart Quiz